
Small Bank, Big Problems
The obituary of the small bank has been written a thousand times. Actually, if you measure since we joined the industry, it’s been written more than ten thousand times. Fewer independent banks exist today than five years ago and only a third the number of 30 years ago. In dynamic Fairfax County, Virginia, there were 34 independent banks and thrifts headquartered in 1990. Today there are eight. Like the corner grocery or neighborhood hardware store, the invisible hand is seeing off a multi-century American legacy of small banks.
We don’t miss the corner grocery very much, but specialty food stores have taken share from traditional supermarkets. Natural food stores such as Whole Foods, Fresh Market and Central Market have loyal customers willing to pay higher food costs for differentiated product. Chains like 7-11 sell commoditized product for premiums based on convenience. Does something like this exist for community banking or is the Canadian model or British model of highly scaled banking what is “natural” and fast arriving for banking in the United States?
It is also hard to ignore non-market factors. In the wake of the financial market meltdown, the FDIC stopped issuing de novo bank charters based on spurious analysis. Using the average rate of annual de novo startups between 1990 and 2008, the economy is missing somewhere between 500 and 1,000 new banks, or more than 10% of today’s total charters. Some academics argue unfriendly market conditions stalled the de novo bank market, but the FDIC purposefully quashed funded startups in 2009 and subsequently imposed capital and regulatory requirements to make the process prohibitive. The heavy hand, not the invisible hand, is contributing to small bank disappearance.
Before speculating on answers to the above, let’s look at some small bank data. We will focus on the thirty years we have been in the business and how things have changed during that time. Also we will look at what most people would consider to be small community banks, certainly not scaled enough in today’s market based on conventional wisdom.
To assess small bank performance, we started with all commercial banks with assets between $100 million and $500 million in 1990 and then inflation adjusted the peer group. By 2016, the peer group size was $184 million to $918 million. Each year becomes a snapshot of how banks of this size perform. It’s best to think of the data as 27 independent snapshots of a seething cauldron of banks growing into the data range and growing out of the range. During the 27 years more than 3,000 banks of this size range sold and a few hundred failed. Even so, the median data is remarkably consistent. The median asset size in 1990, inflation adjusted, was $295 million, while in 2016 it was $334 million, only 10% more. All the years between fall between these two numbers.
At first blush the most basic measure of bank performance, return on assets, doesn’t necessarily support the idea small banks are in long term decline. Median ROA begins in 1990-91 around 1% because of the recession at that time and then rises to the 1.20% to 1.25% range and stays there for fourteen years. The real departure in bottom-line performance is the Great Recession, but a similar performance graph during the recession and after is shared by all banks, regardless of size.
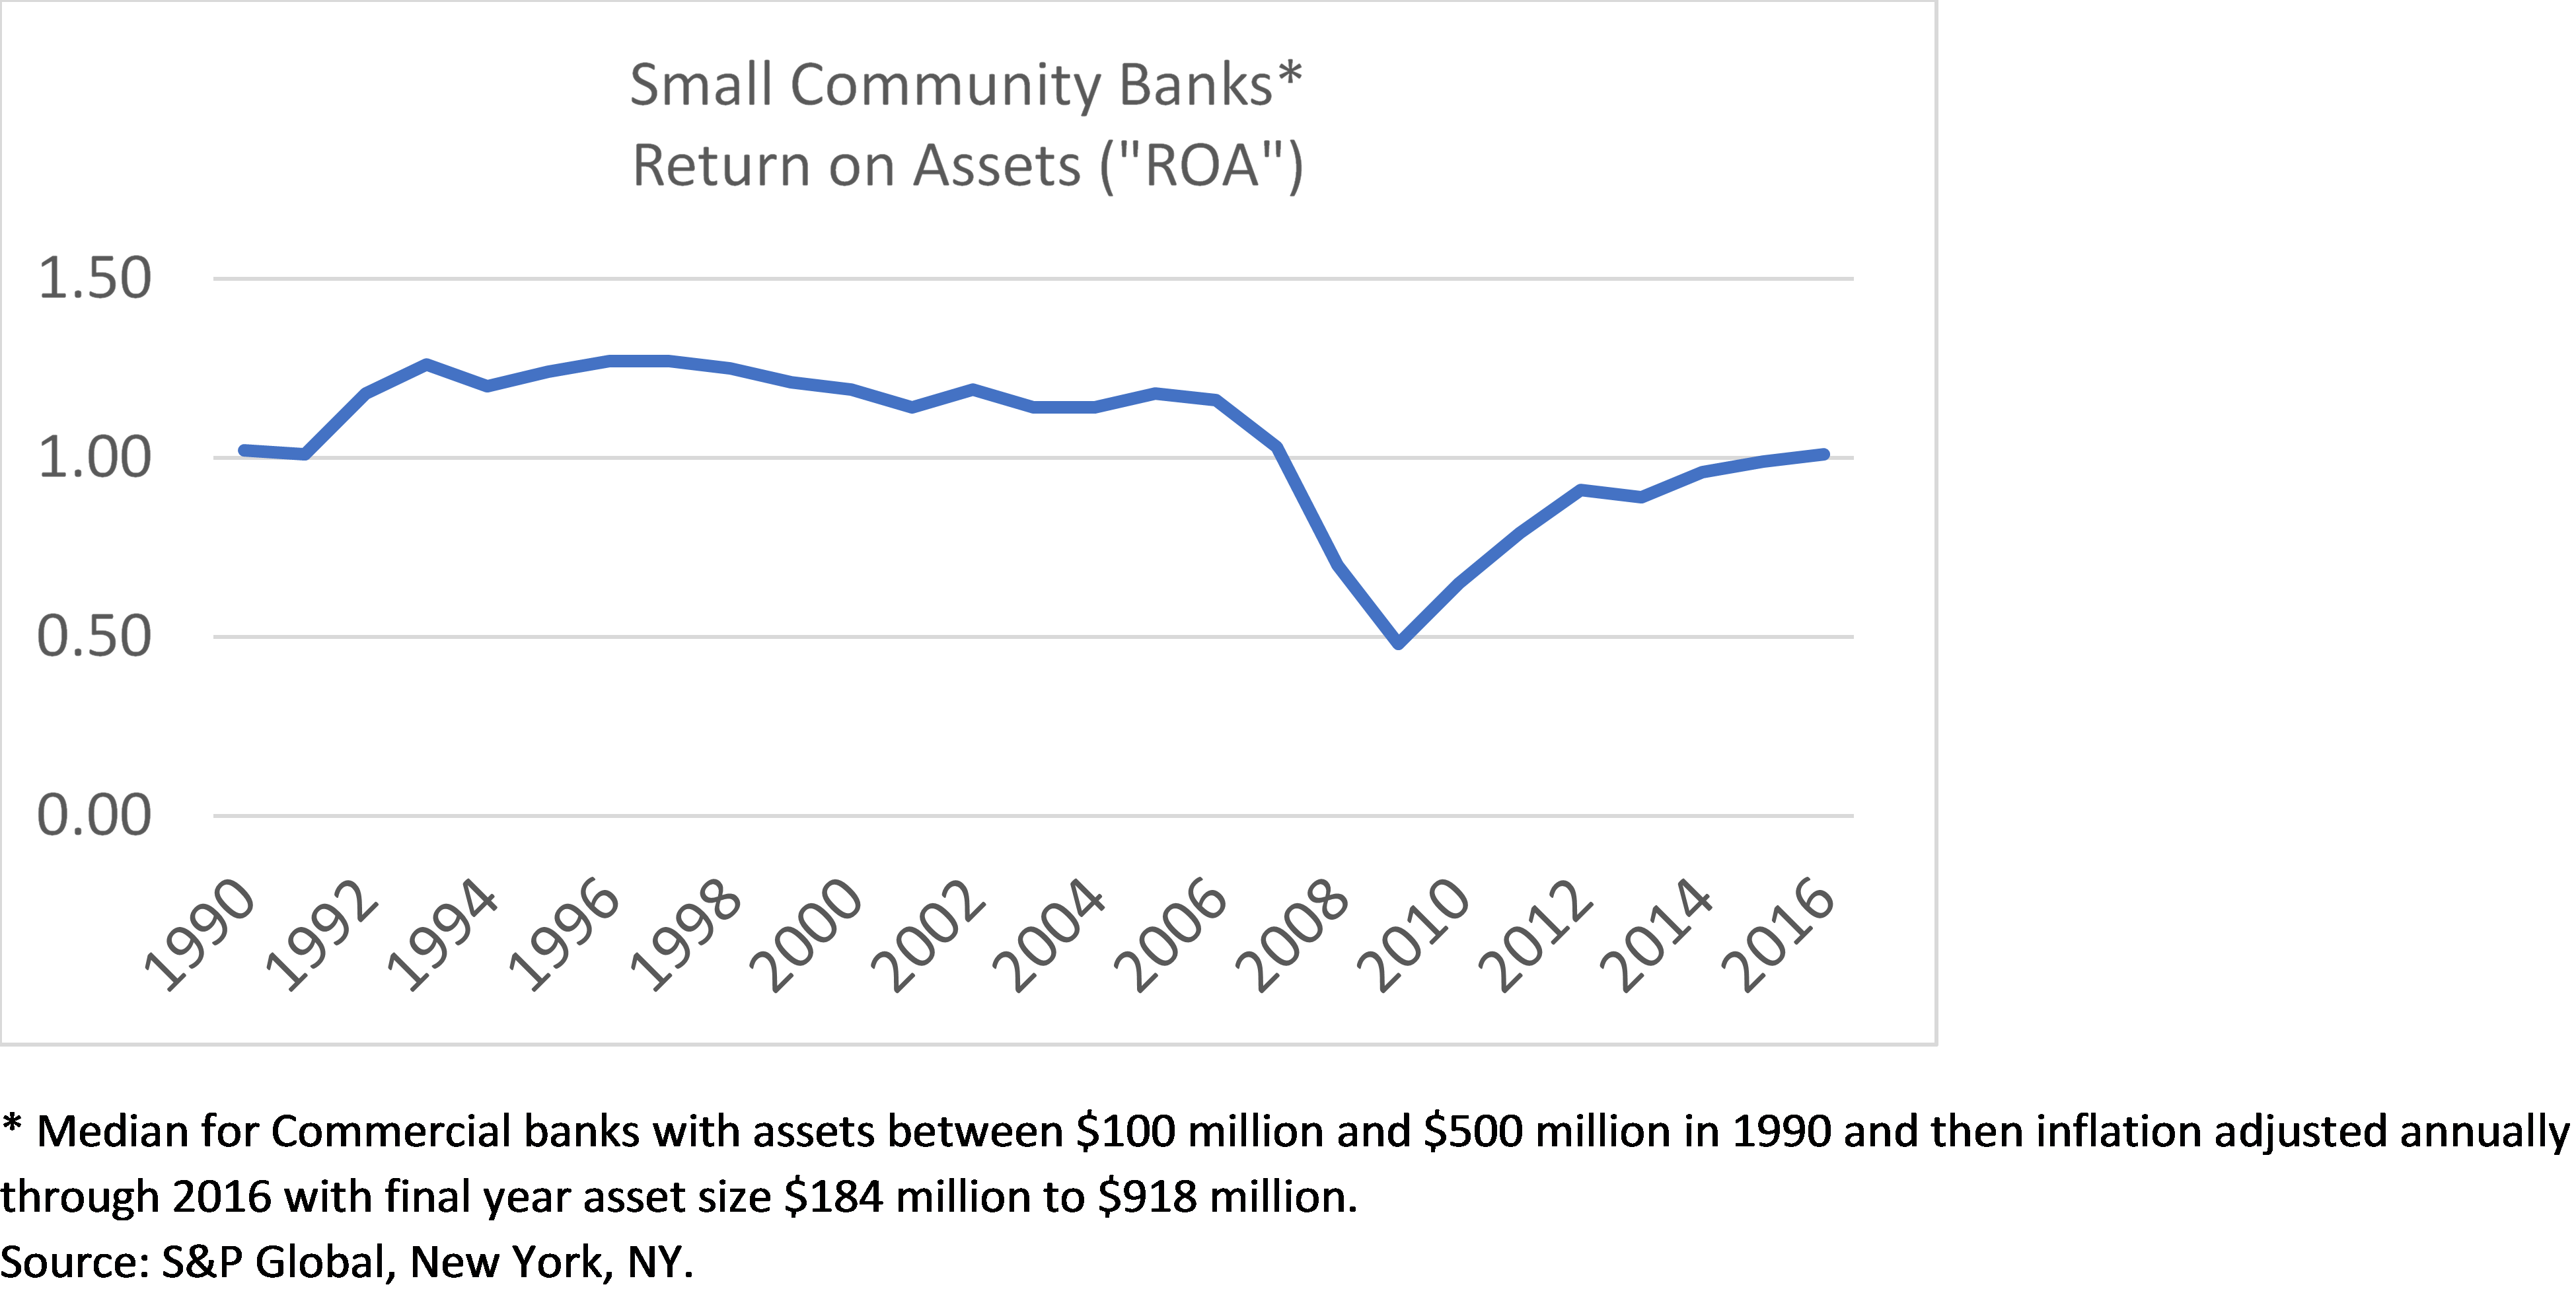
It’s remarkable to note that over half the small bank industry stayed above 50 basis points in ROA right through the Great Recession. The resilience of the many is lost to some observers due to the spectacular failure of the few. ROA recovered and in the latest year was just under 1%. If 1% is the new normal, then ROA for Community Banks has fallen about 20% from the better times of the mid-nineties. So it’s a less profitable business, the question is why.
Noting that spreads for banks have narrowed is not new news. Instead of looking at net interest margin, though, let’s look at the actual inflation-adjusted spread dollars earned by our small community banks. Spread revenue for our median $300 million asset bank was about $12.5 million in the mid-nineties and then began an inexorable decline to today’s $11 million. The bulge in 2005-06 is a skew caused by rapidly rising rates and strong, ill-advised lending leading into the Great Recession. Otherwise it’s an uninterrupted down trend.
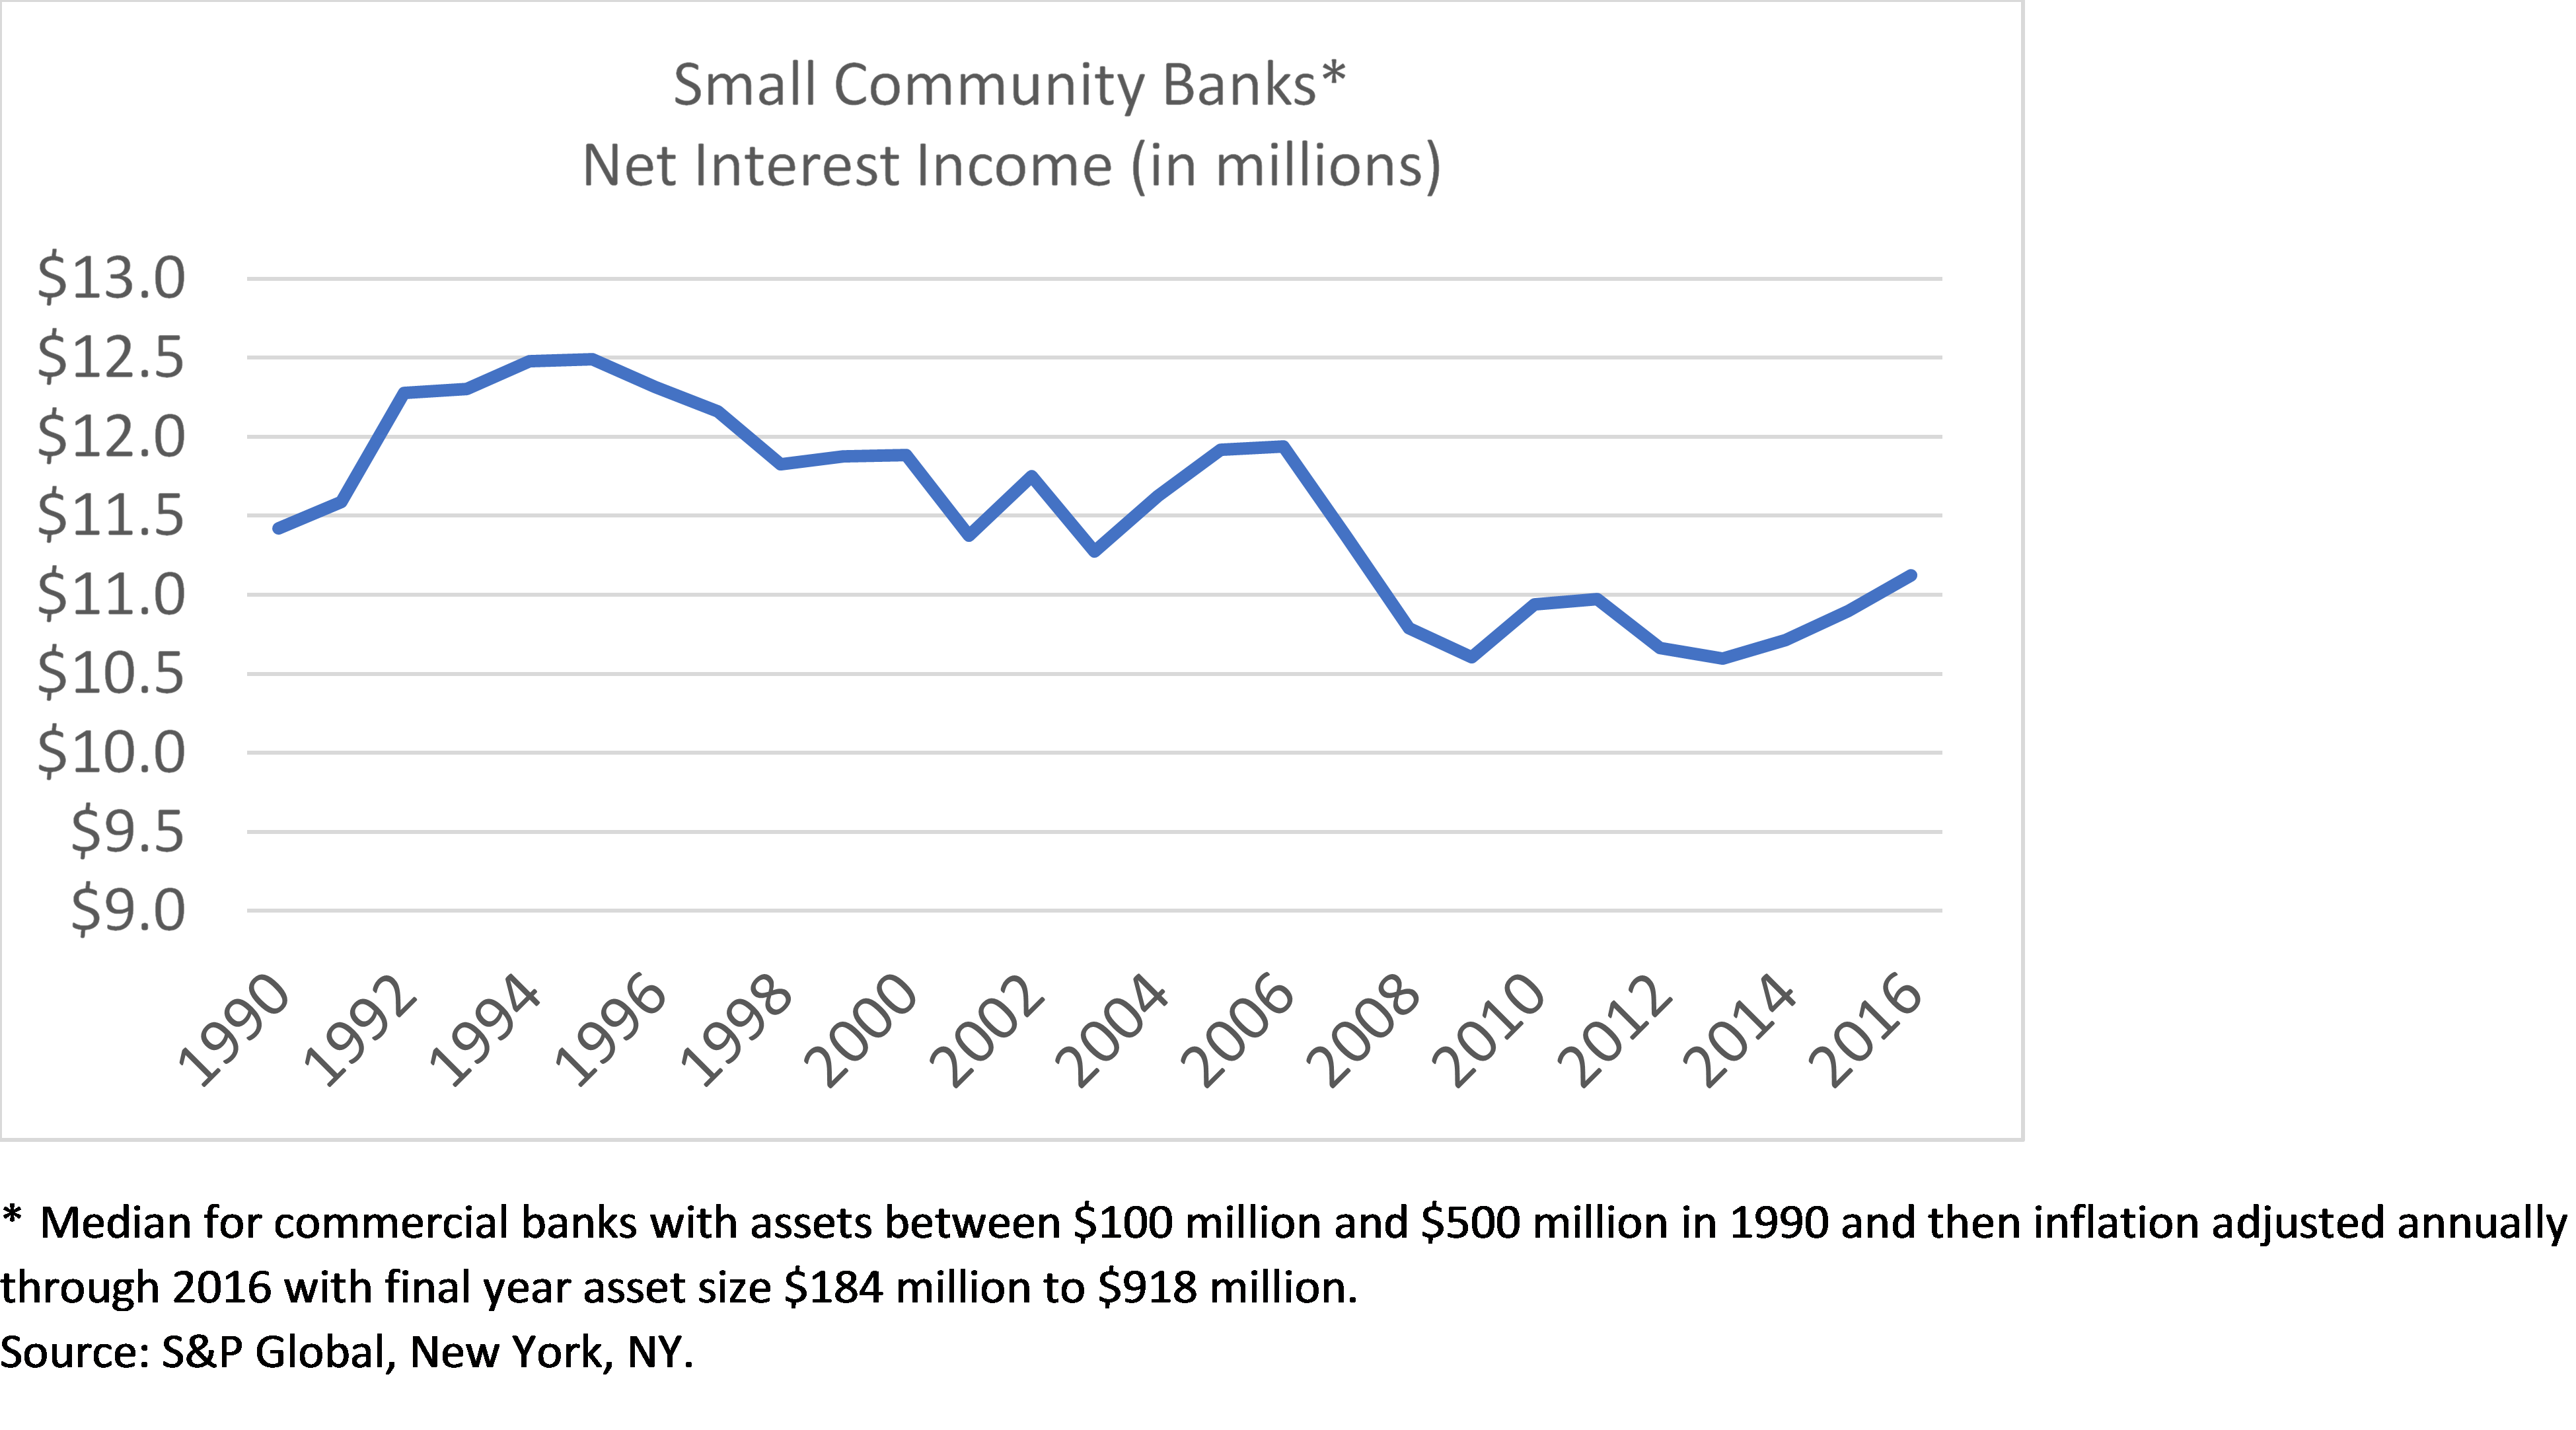
Since 2008 spread income has struggled around the $11 million mark, about $1 to $1.5 million below the “good old days”. For a $300 million asset bank, $1 to $1.5 million corresponds to 20 to 30 basis points of after-tax ROA. Spread might be the whole story relative to the decline in community bank profitability.
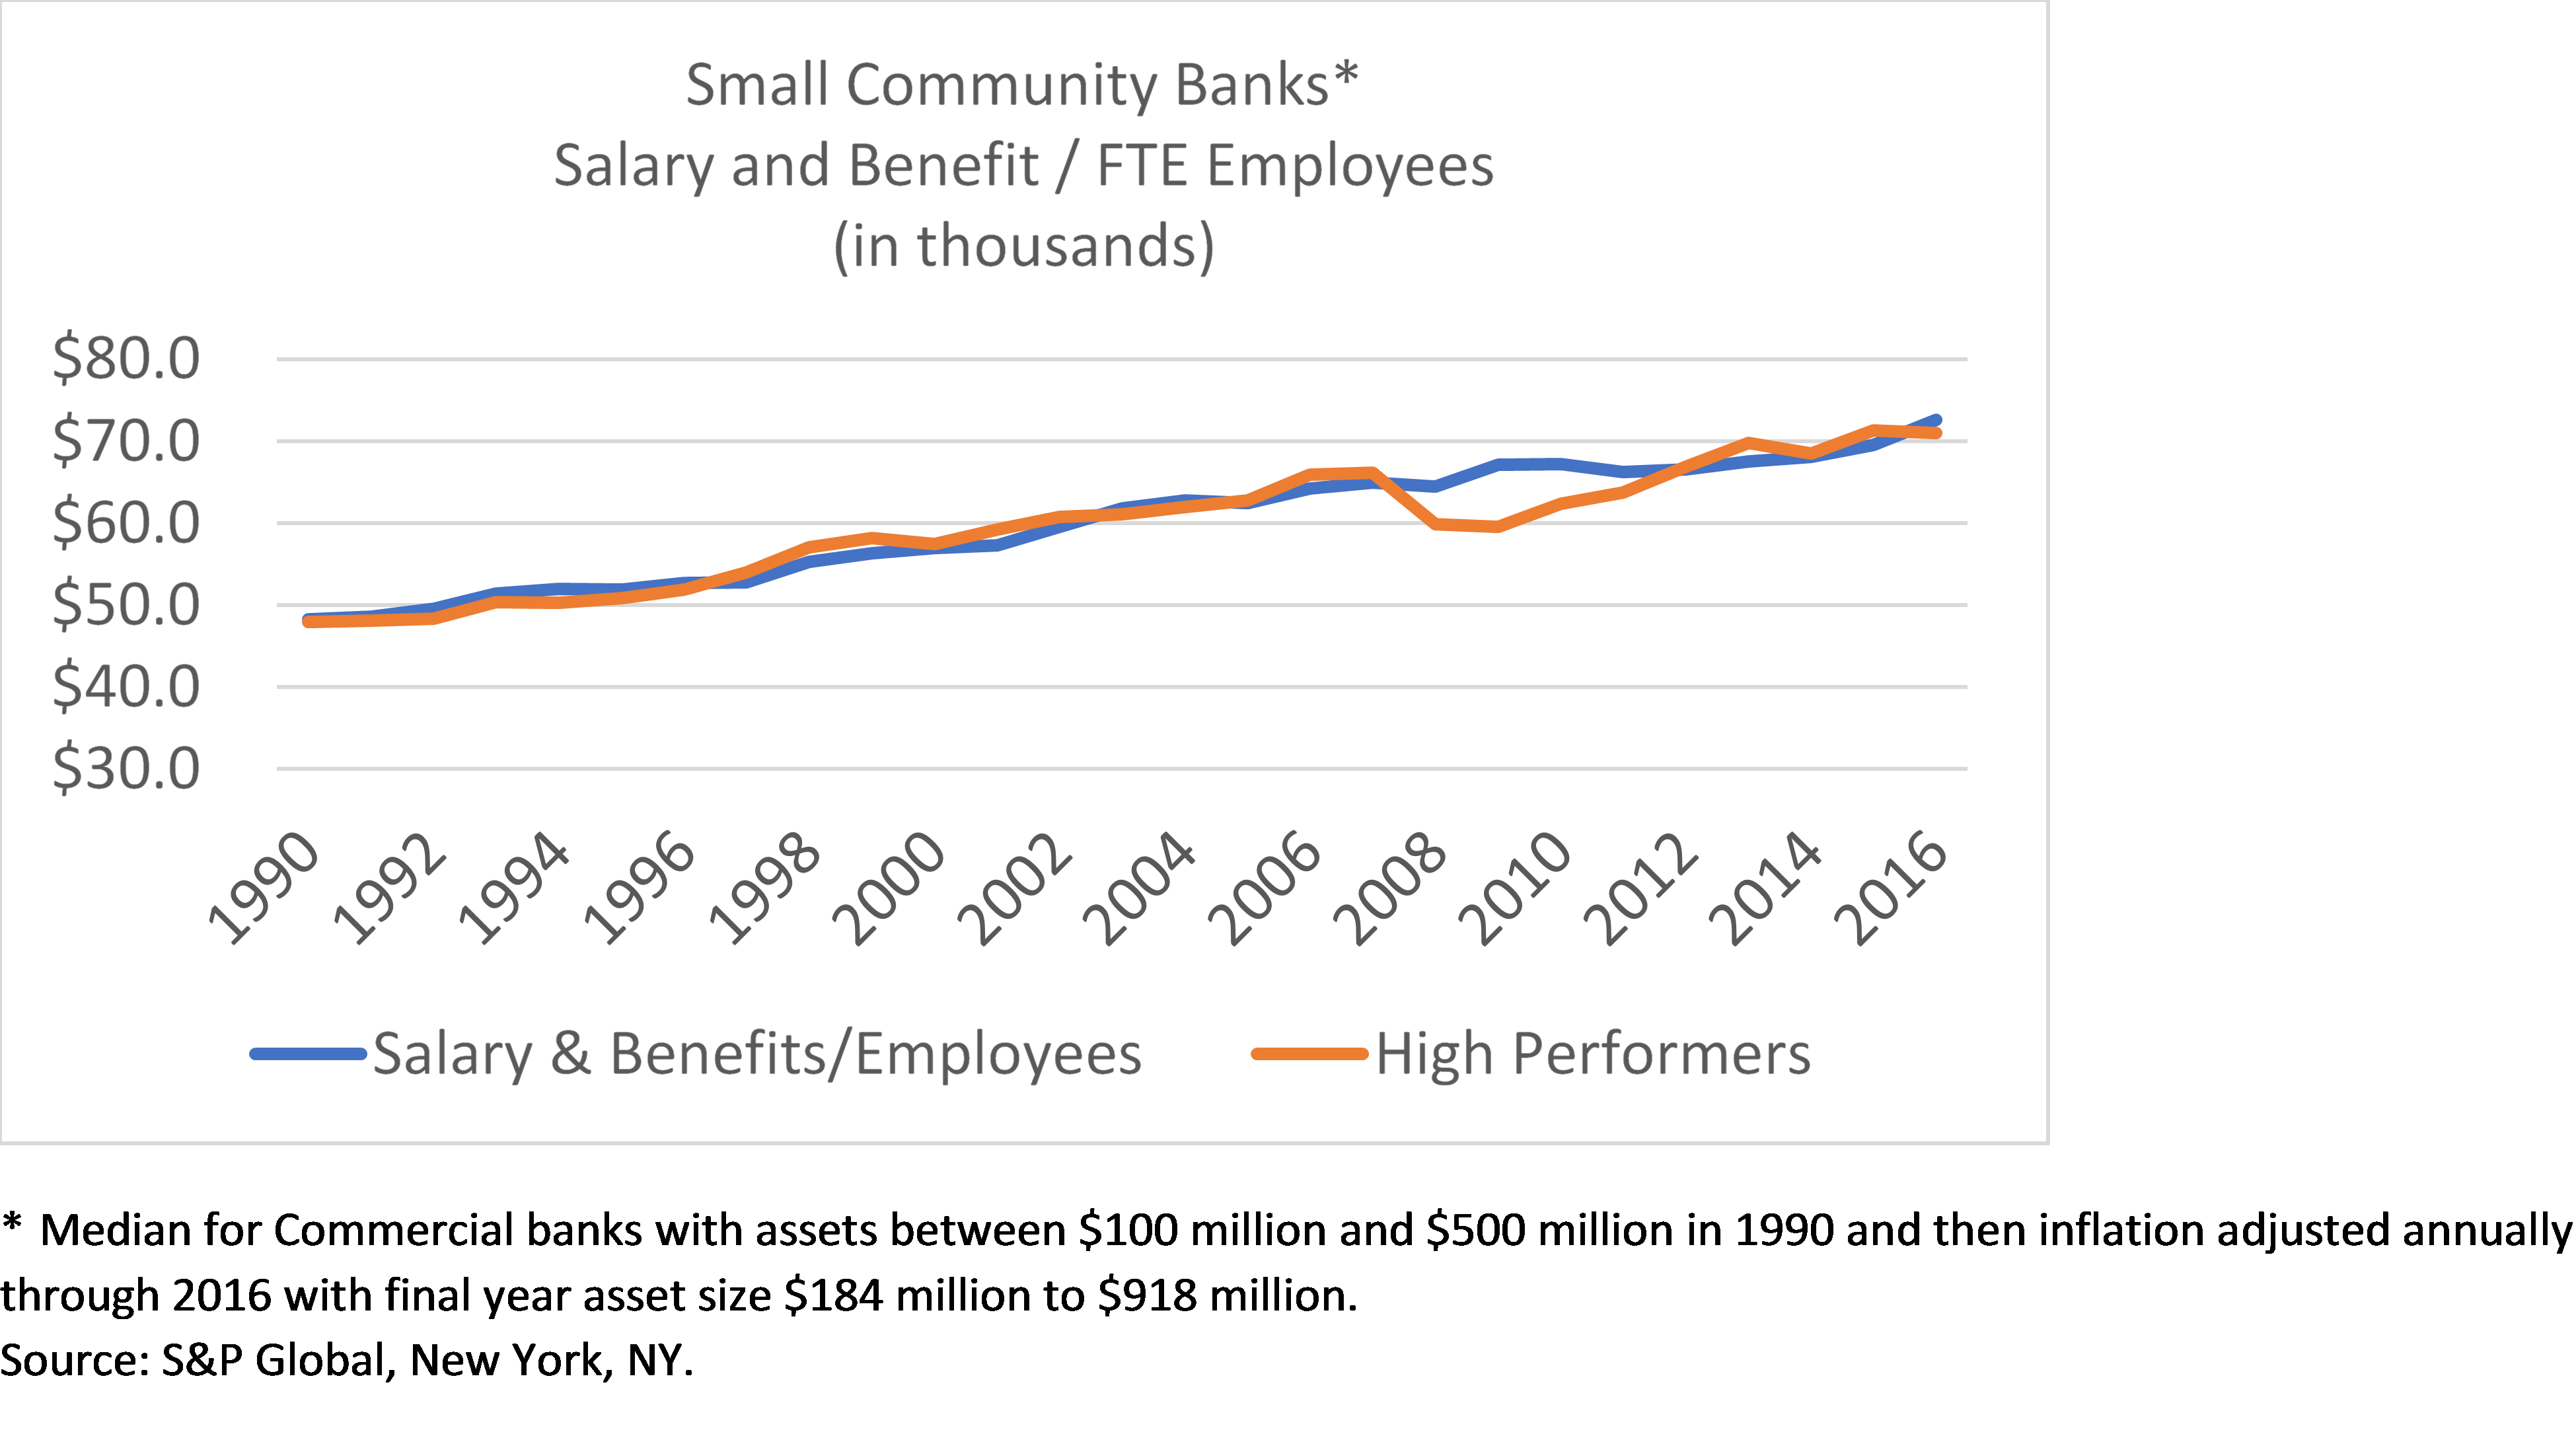
Another chart suggests a different factor is in play. Since 1990, the percent of bank revenue used to pay salary and benefits has risen from 30% to 40%. This persistent trend accelerated in 2006. In 1990 the median cost of inflation adjusted salary and benefit was $4.2 million and in 2016 it was $5.2 million. Here is another $1 million headwind for small banks and it’s not too far from the impact of decline in spread.
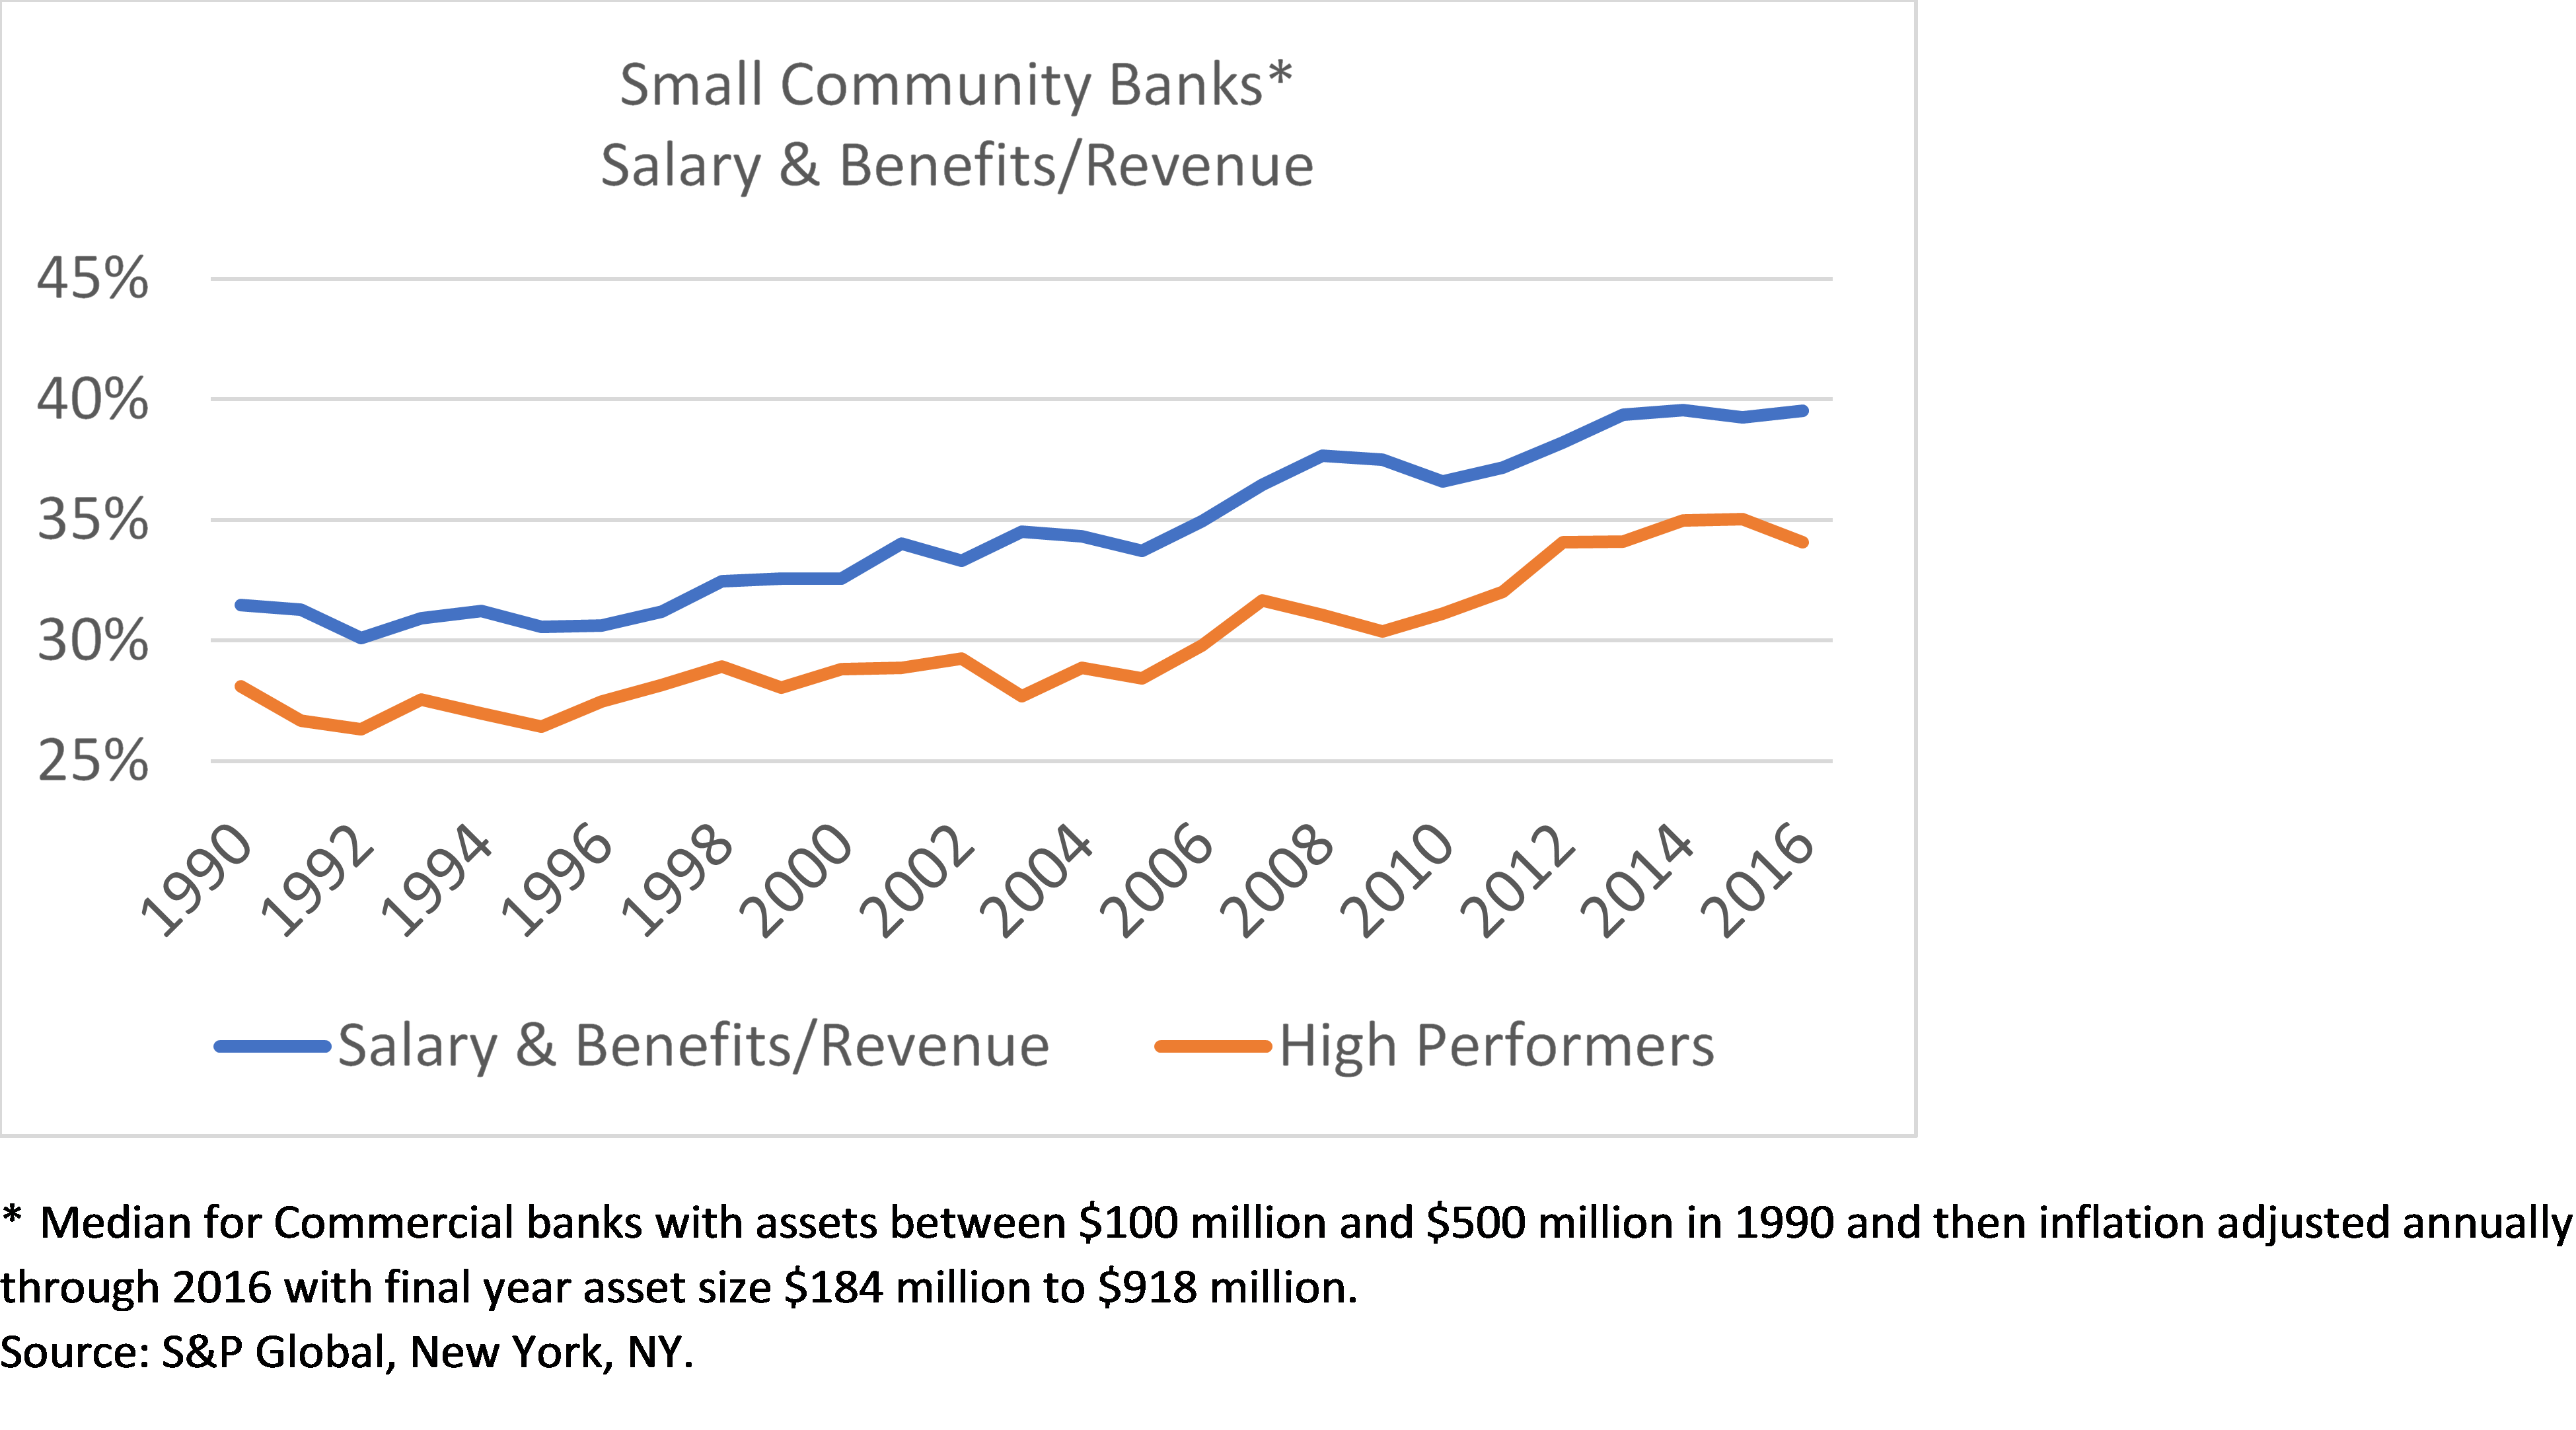
The chart above introduces a second data line corresponding to high performers, which is simply the median of the top half, or 75th percentile of the group. High performers show the same trend of a higher percentage of revenue going to salary and benefit. This persistent differential suggests two things. Salary and benefit is a primary differentiator between outperformance and median performance. Secondly, the competitive effect driving up this cost for banks is equally affecting high performers, they simply start from a lower base.
The rise in total salary and benefit expense as a percent of revenue becomes even more critical when another long term trend is considered. Small banks are operating with fewer and fewer people. Between 1990 and 2016, the median Full Time Equivalent employee count has fallen from about 90 to 70, or just a little more than 20%. This is about one full position per year being eliminated.
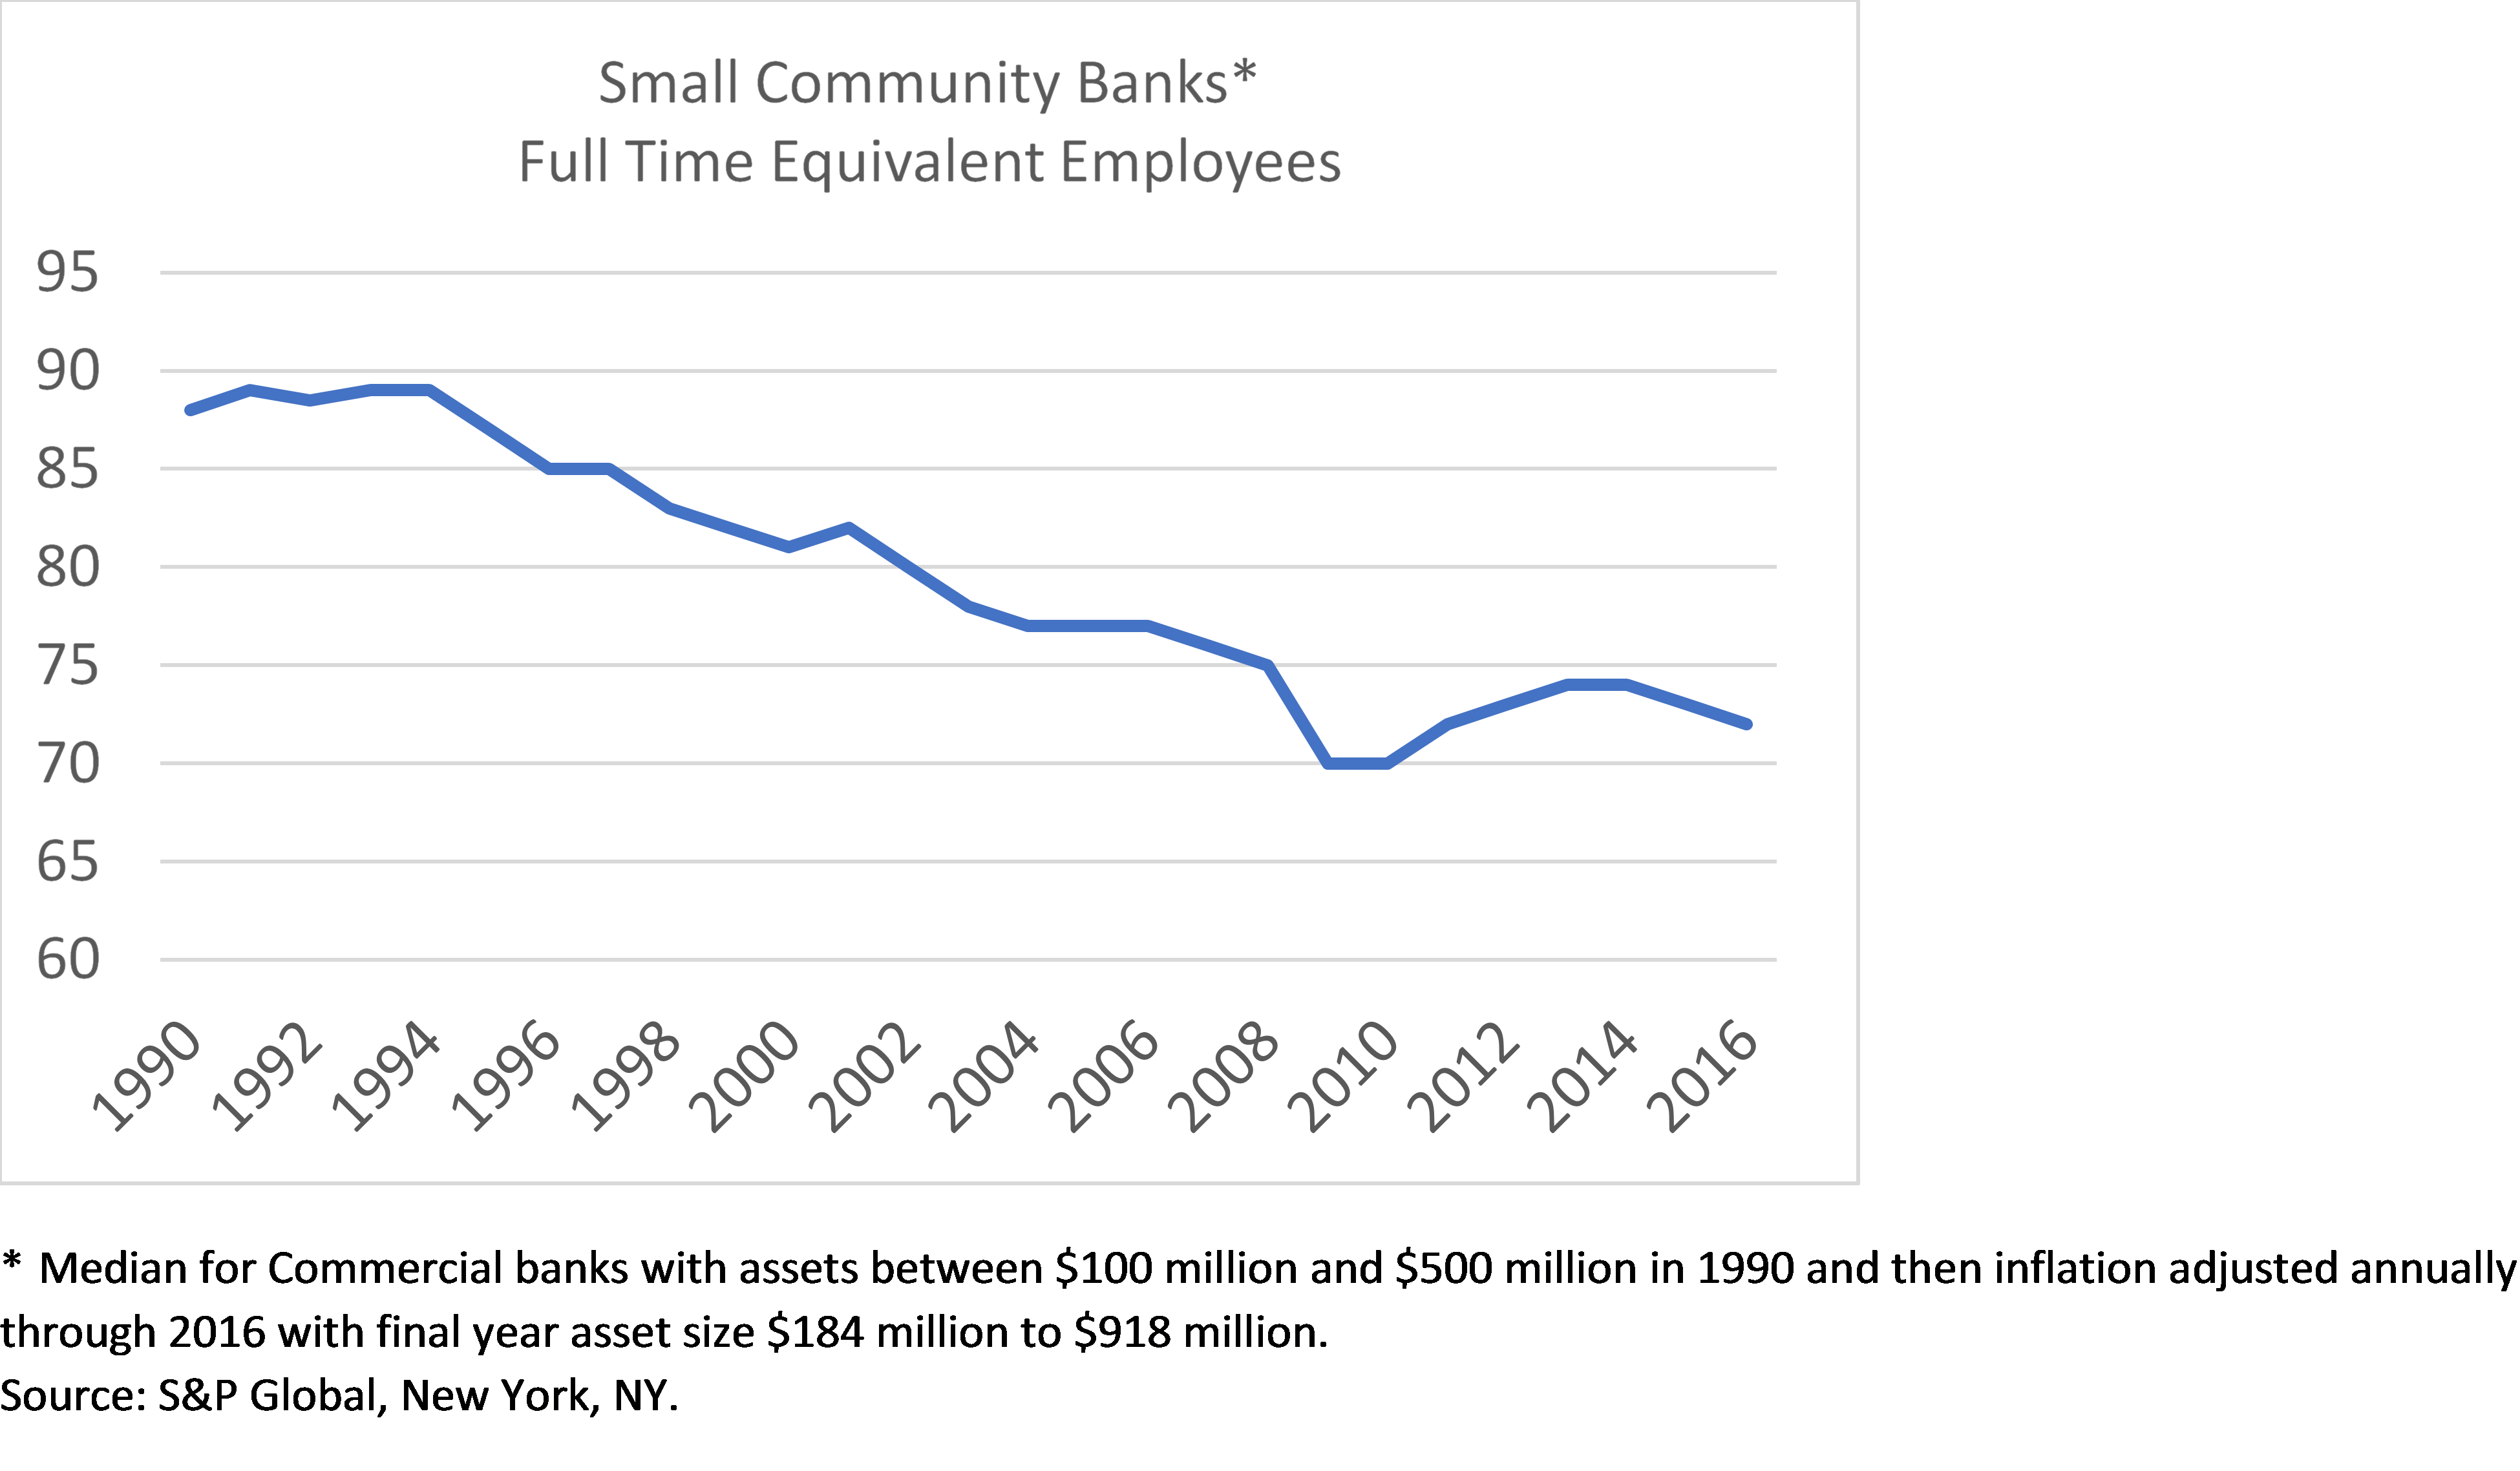
A 20% reduction in workforce is a large efficiency gain, but in spite of this, salary and benefit still rose 20%! The magnitude of these trends can be seen in the average compensation per worker, which has risen from an inflation adjusted $48,000 in 1990 to $73,000 in 2016. The 20% reduction in force has only mitigated a real increase of 50% in average cost per person.
Consolidation and technology are leading to lower and lower numbers of people working in the bank industry overall, but in spite of the massive worker reduction caused by fewer banks and fewer employees per bank, the current employee base commands 50% more per person in salary and benefit than in 1990.
One reason for this is well understood by bankers. Compliance and regulation have altered the workforce mix. Whereas 90% of the workforce used to focus on core fulfillment of deposit and loan services, now there are many more officer level positions in compliance, HR, audit and accounting. The median bank in 1990 may have had five people earning more than $100,000 in inflation adjusted dollars, today there are probably 15.
A changing employee mix is half the story. The balance of the problem is economy wide and has two primary contributors. Real benefit cost has more than doubled since 1990. The same benefit problems afflicting federal, states and municipalities are present in banking, which traditionally has been a high benefit culture.
The second contributor explains why two thirds of the small bank industry can disappear while wages still rise. Bank employees, particularly the more senior employees, are skilled, educated workers with broad opportunities. The United States doesn’t have enough of this category of worker and it shows in the compensation structure of banks. A primary competitive factor weighing on small banks isn’t larger, scaled banks. It’s other successful American enterprises driving up pay for skilled workers.
Returning to the data of the median and high performing community banks, cost per employee for both groups is almost identical. Generally speaking, high performing and median performing banks are paying the same amount for their people. This follows as everyone is competing in the same marketplace. The difference is productivity. High performing banks are getting it done with 10% fewer people.
The bank employee market is a little like Money Ball and professional sports. Getting a quality contribution from each player at every level relative to the dollars spent is cumulatively how an above average achieving team is built. The difference between banking and baseball, though, is in baseball it really is all about the skill of the person in relation to compensation. In banking, skill is important, but there also is a business system in which a skilled person operates. Put quality employees in a poorly designed system and results will still be mediocre.
This then is a thought challenge for any existing small community bank that would like to continue operating independently. What would be necessary for the company to operate with an efficiency ratio below 50%? Most bankers know intuitively this is a very challenging number to execute, but it is particularly so when the median small community bank in our sample is spending 40% of revenue on salary and benefits. Cutting out a branch or two and counting paper clips isn’t going to get it done. Simply paying people less isn’t going to work when it’s is the general economy, not competitors, driving up personnel costs. Pay less and employees will leave even if there isn’t another bank across the street.
There are de novo banking companies, which have pursued different models to meet the market over the last ten to twenty years and are thriving. BofI Federal, Signature, Silicon Valley Bank and Consumers are a few such companies. These four have together accumulated more than $100 billion assets primarily through organic growth. For comparison consider a large regional bank built through acquisition, Suntrust, which has $200 billion assets, 1,312 branches and 25,000 employees. The four banks above have half the assets, but all together only 5,000 employees or 1/5 the amount of SunTrust. It is an order of magnitude different in terms of employee and infrastructure cost. The four banks together have 60 branches or $1.5 billion assets per branch versus $132 million per branch for SunTrust. Again, it is an order of magnitude different. Scale and productivity is more about the amount of business per person and office than it is about the total assets.
Small banks, unlike the corner grocery, are not being put out to pasture by larger competitors. A combination of government policy, margin pressure and economy level competition for skilled workers is weighing heavily on the viability of the business model. Merging wouldn’t have made the corner grocery or hardware store viable. This isn’t true in banking, and there are regional companies well equipped to compete even facing lower spread and higher personnel costs. Fewer does not necessarily mean none. More enlightened government policy together with decent economic growth could bring a renaissance to select bankers, who align their business structure and personnel with the new realities.